Why do perfectly intelligent people believe in Climate Change?

Andy Edmonds, PhD

The operative word in this somewhat leading question is “believe”. Global warming is a belief system with all the characteristics of a religion.

Look at how non-believers are vilified. Look at how we are told we must make sacrifices to the god of global warming; to sacrifice little old ladies through their unaffordable heating bills; to sacrifice our countryside to windmills and solar farms; to sacrifice our cars and our mobility.

How did we get to this point in our supposedly rational age?

The answer, I believe, lies in the history of ideas themselves. To grossly, but unavoidably, oversimplify things, the argument is as follows:

One of the major purposes of religion is to explain the seemingly random events that occur to us as individuals and societies.

The demise of Christianity in the West has led to, or was caused by, a rise in scientific rationalism. The latter has given us better explanations for the events in the world, and held out the promise, as espoused by Laplace in 1813, of total predictability, of understanding everything scientifically.

Thus, one all-powerful God has replaced another.

The success of scientific rationalism has spawned political and social ideas that ape the promise of predictability and explainability that Science promises in the physical world.

Unfortunately, since the start of the 20th century, various chinks in the scientific rationalists’ armour have appeared. Mathematical research encouraged by the growth of computing has shown conclusively that parts of the world and the things in it are not predictable and computable without infinite computing resources.

The God of Scientific rationalism is not all-powerful.

Climate, it turns out, is one of the things, like weather, that cannot in practice be predicted long-term. Other examples are social, financial and political phenomena.

It would take many thousands of words to justify the last claim, but it is true, and a fact well known to researchers in Complexity.

A God is, of course, either all powerful or a false God. There can be no half measures, and a Scientific area of study that cannot make predictions has no value.

To believe in climate change is to believe in the God of Scientific rationalism. To embrace the unfortunately complex idea that parts of our world are ultimately and forever unpredictable is to give up on this God.

Most people, while capable of deep thought at times, live life with a set of heuristics that they use to simplify things. The idea that science is completely trustable, and capable of predicting anything is one of these heuristics. The idea that this might not be true is an exceedingly tough thing to sell.

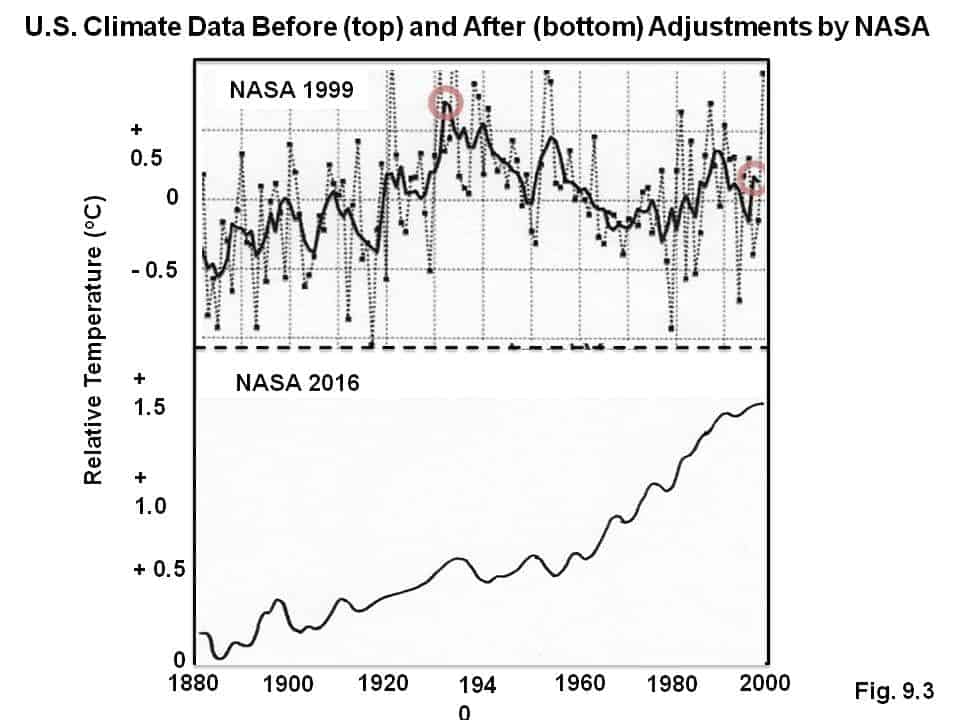
Although there is some element of conspiracy in the global warming scare, (Climate scientists have wilfully ignored the evidence that their predictions are worthless), Global warming has been just very convenient for those with a religious predisposition and with a fear of Chaos. Unfortunately, these people include politicians and princes. People who are already predisposed to an ideology, to simple explanations for complex things, find Global warming very seductive.

So, while the scientific basis for belief in climate change crumbles, the religious argument increases in strength.

Because letting go of these ideas will cause so much psychological distress to the holders, they will hang on to them ’til the last minute. At the time of writing, the UK’s outgoing prime minister just committed the UK to zero carbon by 2050, without a vote or any democratic oversight, and at a cost of many trillion pounds.

This was a religious act. Other religious acts in the past have given us the great cathedrals, the Parthenon and Angkor Wat. On the other hand, some have given us the inquisition and jihad.

This decision definitely falls in the latter category.

I’m sure, dear readers, that many of you will profoundly disagree with the preceding ideas. If so, all that I ask is that you question yourselves as to why. Are my arguments rubbish? Or is it the uncomfortable feeling of having cherished ideas challenged? If it’s the latter, you’ve got religion, my friend.

Andy Edmonds gained his PhD in the analysis of time series for Chaos in 1996. Although not a climate scientist, he is an expert in the mathematics and techniques underlying the modelling of phenomena such as climate.

Do any of these “climate change” eggheads realize how stupid they sound?

MrEricksonrules

“The sky is falling, the sky is falling!”

“Climate change!  Global warming!  The ice is melting!  The oceans are rising!

fresh 9

Although this is a recurring occurrence for these alarmist propagandists, most recently, I’m referring to a couple of articles that I came across.

The first article is by Christopher Carbone of Fox News, and the headline states, “Mysterious freshwater reservoir found hidden beneath the ocean!”

My first thought is, “okay, this sounds pretty interesting,” but the more I think about it, the less surprised I am by the discovery.

But they’ve peaked my interest…, so let’s proceed.

My next thought is, “Aren’t most things in life and our planet “mysterious?”

I would think the word “mysterious” would be a word that scientists would not be too fond of, however, as it seems to imply something not very scientific, but more supernatural, more beyond our understanding.

The truth is that there is a heck of a lot more that scientists don’t understand than they do understand.

Carbone continues, “Scientists discover world’s largest freshwater aquifer underneath the ocean floor.”

“Surveying the sub-seafloor off the eastern coast of the United States, researchers at Columbia University uncovered what appears to be the world’s largest freshwater aquifer. Believed to hold at least 670 cubic miles of fresh water, the discovery could usher in similar discoveries for other regions throughout the world.”

fresh 1

“The surprising discovery, from a new survey of the sub-seafloor off the northeast U.S. coast by researchers from Columbia University, appears to be the largest formation of this type anywhere in the world — stretching from Massachusetts to New Jersey and extending continuously out about 50 miles to the edge of the continental shelf.”

“Researchers said that if it was discovered on the surface it would create a lake covering some 15,000 square miles.”

That would be about half the size of Lake Superior, or about two-thirds the size of Lake Michigan.

‘“We knew there was fresh water down there in isolated places, but we did not know the extent or geometry,’ lead author Chloe Gustafson, a PhD. candidate at Columbia University’s Lamont-Doherty Earth Observatory, said in a press statement.”

Okay…, this is all very well and good…, but I would have to question whether “we” knew this “fresh water” was down there, or if “we” only suspected it.  I don’t ever recall hearing anything about this type of thing before.

But here’s the kicker that justifies the use of the term “egghead.”

“Scientists also said that if the water was to ever be processed for consumption, it would need to be desalinated.”

Wait…, what?

Desalinated?

You “scientists” do understand that if the water would need to be “desalinated,” THEN IT’S NOT FRESH WATER!  IT’S SALT WATER!

I’m sorry, but am I missing something?

“The study was [original] published in the journal ‘Scientific Reports.’”

And none of the other “scientists” felt it necessary to point out that referring to salt water as fresh water kind of changes the whole concept of the report?

Brilliant.

fresh 4

Next we have an article by Karl Mathiesen for “The Guardian” website that asks, “Why is Antarctic sea ice at record levels despite global warming?”

Good question!

How dare this ice act in a way that contradicts all of our “climate change” claims!

“While Arctic sea ice continues to decline, Antarctic levels are confounding the world’s most trusted climate models with record highs for the third year running.”

fresh 2

So the Earth is “confounding” “the world’s most trusted climate models” with its ice growth? And for the third year in a row?

This sure doesn’t jive with the “climate change propaganda” I’ve been hearing over the past couple of years.

How about you?

And doesn’t it make sense that while the Arctic ice levels are in decline, the Antarctic ice levels are increasing?

You know…, I bet if you looked back in history, at times when the Antarctic ice levels were in decline, the Arctic ice levels were on the rise.

Just a guess.

Nothing scientific, but…, hey…, at least their claims and my claims would have that in common!

Mine would just make more sense, that’s all!

fresh 7

“Antarctic ice floes extended further than ever recorded this southern winter, confounding the world’s most-trusted climate models.”

“Ice floes extended further than EVER recorded!”

“Ever” is a long time.

‘“It’s not expected,’ says Professor John Turner, a climate expert at the British Antarctic Survey. ‘The world’s best 50 models were run and 95% of them have Antarctic sea ice decreasing over the past 30 years.’”

Like Gomer used to say, “Surprise, surprise, surprise.”

If those are your “50 best models,” and they are all pathetically wrong, what are you basing your claims on and why should anyone listen to anything you have to say?

Just sayin’.

“But Dr. Claire Parkinson, a senior scientist at Nasa’s Goddard Space Flight Centre, says increasing Antarctic ice does not contradict the general warming trend, ‘Not every location on the Earth is having the same responses to climate changes. The fact that ice in one part of the world is doing one thing and in another part ice is doing another is not surprising. The Earth is large and as the climate changes it is normal to see different things going on,’ says Parkinson.”

fresh 8

Wow.  You are wise Dr. Claire.  I’m pretty sure that most 5th graders could have made those deductions.

And basically what you’re saying is that no matter what happens with the Earth’s climate, we can twist it around to support our claims of global warming.

The “climate” changes all of the time, and we’ll give you that.  It’s been changing since the beginning of time, and all by itself, with no help from humans.

fresh 6

“In a video made by Eco Audit reader and journalist Fraser Johnston, Dr. Guy Williams, a sea ice scientist at the Tasmanian Institute for Marine and Antarctic Studies, says that even though it had fooled climate models the increasing sea ice was well understood by scientists.”

‘“In some ways it’s a bit counterintuitive for people trying to understand how global warming is affecting our polar regions, but in fact it’s actually completely in line with how climate scientists expect Antarctica and the Southern Ocean to respond. Particularly in respect to increased winds and increased melt water,’ said Williams.”

Okay…, so these ice occurrences are “well understood” and “completely in line with how climate scientists expect Antarctica and the Southern Ocean to respond,” yet earlier, Professor John Turner was quoted as saying these results were “not expected.”

So what is it?  Was this ice situation expected by you “scientists” or not?

It kind of sucks when reality doesn’t line up with your propaganda, doesn’t it, docs?

I get the feeling that the next “climate change” study that we get to read about will being with the words, “Once upon a time…”

fresh 5


NOTE:  If you’re not already “following” me and you liked my blog(s) today, please “click” on the comment icon just to the right of the date at the bottom of this article.  From there you can let me know you “like” my blog, leave a comment or click the “Follow” button which will keep you up to date on all of my latest posts.

Thank you, MrEricksonRules.

MIT Doctorate Climate Scientist Slams GW Claims: Based On “Untrustworthy, Falsified Data”…”No Scientific Value”!

In a newly released Kindle book that is set to peeve established climate science, an MIT doctorate climate researcher blasts alarmist claims of a warming planet and illustrates how temperature data are untrustworthy and far too scant to draw sound conclusions.

By Kirye and Pierre Gosselin

Dr. Kiminori Itoh just brought to our attention a recently released Kindle version Japanese climate skeptical book with the title: kikoukagakushanokokuhaku chikyuuonndannkahamikennshounokasetsuauthored by Dr. Mototaka Nakamura.an scientist who received doctorate from MIT.

The book’s title translated in English: “A climate scientist’s profession – Global warming theory is unproven, only a hypothesis“.

Climate scientist Dr. Mototaka Nakamura’s recent book blasts global warming data as “untrustworthy”, “falsified”.  Image: http://iprc.soest.hawaii.edu/people/nakamura.php

In his book, Dr. Nakamura explains why the data foundation underpinning global warming science is “untrustworthy” and cannot be relied on.

“Not backed by demonstrable data”

He writes that although many people, including a lot of climate researchers, believe it is a confirmed fact that global surface mean temperatures have been rising since Industrial Revolution, it is however “not backed by demonstrable data”. He points out:

Global mean temperatures before 1980 are based on untrustworthy data. Before full planet surface observation by satellite began in 1980, only a small part of the Earth had been observed for temperatures with only a certain amount of accuracy and frequency. Across the globe, only North America and Western Europe have trustworthy temperature data dating back to the 19th century.”

Prestigious career

Dr. Nakamura received a Doctorate of Science from the Massachusetts Institute of Technology (MIT), and for nearly 25 years specialized in abnormal weather and climate change at prestigious institutions that included MIT, Georgia Institute of Technology, NASA, Jet Propulsion Laboratory, California Institute of Technology, JAMSTEC and Duke University.

Failed climate models

Nakamura’s book demolishes “the lie of critical global warming due to increasing carbon dioxide”, exposes the great uncertainty of “global warming in the past 100 years” and points out the glaring failure of climate models.

Only 5% of Earth’s surface adequately measured over past 100 yrs,,,,,,,,,,,,,,

According to Dr. Nakamura, the temperature data are woefully lacking and do
not allow in any way the drawing of any useful conclusions.

Presently the book is available in Japanese only. What follows are translated/paraphrased excerpts.

For example, Dr. Nakamura illustrates how scant the global temperature data really are, and writes that over the last 100 years “only 5 percent of the Earth’s area is able show the mean surface temperature with any certain degree of confidence.”

Ocean data extremely scant…

Then there’s the desolate amount of data from the massive oceans. Later Dr. Nakamura describes how the precision of the observed mean temperature from the ocean surface, which accounts for roughly 75% of the Earth’s surface, are questionable to an extreme.

He writes, “The pre-1980 temperature data from the sea and water are very scant” and that the methodology used for recording them totally lacks adequacy.

To top it off: “The climate datasets used for the sea surface water temperature data have added various adjustments to the raw data.”

1 station per 10,000 sq km almost meaningless

Dr. Nakamura also describes how the number of surface stations used globally cannot provide any real accurate temperature picture. He writes: “Experts cannot just decide that 10,000 sq km per station is representative of temperature.”

Later he explains: “If you accept the Earth surface mean temperature’s warming since the Industrial Revolution as the truth, it means you agree with the idea that the Earth surface mean temperature rise can be determined by a biased tiny region on the globe. It is nonsense. Looking at the regions with long term temperature data, you can see that some regions warmed, and some other regions cooled.

Nakamura’s harsh judgement: “No scientific value”

Finally, Nakamura blasts the ongoing data adjustments: “Furthermore, more recently, experts have added new adjustments which have the helpful effect of making the Earth seem to continue warming”. The talented Japanese scientist deems this “data falsification”.

He concludes:

Therefore, the global surface mean temperature change data no longer have any scientific value and are nothing except a propaganda tool to the public.”

The Wild Winter of 2018/19 in North America

The snowcover in North America ranked first or second in 50+ years from September to November and bounced to 4th in February.

Screen Shot 2019-06-20 at 5.08.40 AM.png

namgnld_season4.png

It fell back but still above trendline in winter. 2009/10 was the record high.

namgnld_season1.png

It lingers in the west with as much as 4783% of normal in the central Rockies. Note the below normal SWE in the Cascades and northern Rockies this June.

Screen Shot 2019-06-20 at 5.07.15 AM.png

As of two days ago according to Snow brains, skiers were still skiing on 100″ of snow on Mammoth Mountain – 292% of normal.

Screen Shot 2019-06-20 at 5.33.07 AM.png

More snow will fall as the solstice passes.

ecmwf-west-total_snow_10to1-1852800.png

​COLORADO’S STATEWIDE SNOWPACK HOLDING STRONG AT 1301% OF NORMAL — GRAND SOLAR MINIMUM

JUNE 20, 2019 CAP ALLON

Following an historically snowy winter and spring, Colorado’s snowpack currently stands at 1301% of normal, with highs peaking at 3328% in the San Juan Mountains, according to Natural Resources Conservation Service data.

As of Wednesday, Colorado’s snow-water equivalent was 5.2 inches. The median for June 19, based on 30 years of record-keeping, is just 0.2 inches.

“By June 19, the snow is usually all melted out, at least from where we measure,” said Peter Goble, a climatologist with the Colorado Climate Center. But as of Wednesday, a staggering 18% of this season’s snow has yet to melt.

This past winter brought one of the best snowpacks to Colorado in over 40 years. Then, the coldest May since 1995 (solar minimum of cycle 22) set the conditions for the pack to linger.
Colorado-Snowpack-June-19-1
Furthermore, all that spring runoff means Colorado’s reservoirs are now expected to completely refill — the Lemon and Vallecito reservoirs, for example, are already at about 90% capacity.

“It looks like many reservoirs in the state will fill,” Goble said. “Even some of the ones that were critically low over the winter following the drought in 2018.”

AGW Alarmists will have to pick a different cherry to cry about.

In addition, winter still hasn’t completely released it’s icy grip on Southwest Colorado — the NWS is calling for more anomalous cold and even snow in the high country through Saturday night.

—————–

The Finnish Meteorological institute show the total snow mass for the Northern Hemisphere was well above the average for 1982-2012 in late winter and early spring.

fmi_swe_tracker.jpg

Snow lingers in the Wisconsin cities of Eau Claire and Appleton, even with Summer just days away

SNOW LINGERS IN THE WISCONSIN CITIES OF EAU CLAIRE AND APPLETON, EVEN WITH SUMMER JUST DAYS AWAY

JUNE 19, 2019 CAP ALLON

This year’s record-breaking winter dumped almost 100 inches of snow on Wisconsin’s Eau Claire and Appleton, and for parts of those cities, that snow is proving particularly stubborn, refusing to melt even with the start of summer now just days away.

Screen Shot 2019-06-20 at 5.31.06 AM.png

Eau Claire’s Galloway Street is one of those places. The street was a dumping ground for all the snow that accumulated roadside throughout the winter. Persistent cold in the city has meant the pile has stuck around a lot longer than normal:

WEAU 13 News@WEAU13News

This year’s record-breaking winter dumped almost 100 inches of snow on Eau Claire. For one part of the city, the snow still isn’t gone. https://www.weau.com/content/news/For-parts-Eau-Claire-there-are-still-snow-piles-waiting-to-melt-511425652.html

6:37 PM – Jun 17, 2019

EAU CLAIR SNOW.png

Snow remains in parts of Eau Claire mid-June

This year’s record-breaking winter dumped almost 100 inches of snow on Eau Claire. For one part of the city, the snow still isn’t gone.

The story is the same for towns and cities across much of Wisconsin, including in Appleton — located a 3 hour drive east of Eau Claire.

The Appleton Post Crescent reports that the same parking lot held powder into June last year as well, but that was thought to be due to the 20-plus inches of snow that fell during a record-setting mid-April blizzard.

The city doesn’t have the same excuse this year.

It’s the anomalous cold keeping the snowpack in place this time around, which correlates neatly with the sun entering its next Grand Solar Minimum cycle. The cold times are returning. Even NASA agrees:

NASA SOLAR.png


Remember 2015 in Boston where after 110 inches of snow – most of it falling in 5 frigid weeks at the end of winter, snow piles remained well into summer.

Rutgers/NOAA shows the spring snow is for the 3rd straight year above trendline. Note that NOAA advised around 2000 on their web site not to compare spring and summer numbers after 2000 with prior years as their methods changed towards more of an automated – albedo based approach and any snowpack beneath conifers or in the open not refreshed with new snow may be missed. Strong blocking in the spring of 2010 (after record snow in the Mid Atlantic) had the snow disappear very early from eastern Canada and the northeast US mountains, a warm 2012, and 2016’s strong El Nino were lean years.

Crop Failure Year Looms – Ice Age Pattern?

Written by Musings from the Chiefio

No crop damage from SE rain | Farm Online

There has been a shift in the weather toward the Little Ice Age pattern, with big storms, late heavy rains, flooding, and even snow into the start of Summer / late Spring at higher elevations.

Not just in the USA, but all over. Europe, China, Russia, Australia, New Zealand, South America. This has resulted in lots of crop losses, very late planting (or even not planting), and price rises.

Some long time ago I did a story about hay. Most city folks don’t think much about hay, but it is what gets your grazing farm animals through the winter and onto fresh spring pasture. Horses and cows are called “hay burners” for a reason. While lately we have gone to a more exotic collection of feeds, including DDG Distillers Dried Grains from making all that ethanol for diluting gasoline, hay is still an essential.

We entered this year with low hay inventory due to low rainfall in the northern hay producing regions in prior years. Then this year has been so wet that transporting and harvesting hay have been problematic. Finally, a very late start to spring pasture growth means feeding hay longer… when none can be had… That’s a problem.

So hay prices have shot way up. Folks who feed hay to cattle are selling the animals to meat packers early (so buy and freeze some beef now…) while folks who have horses are paying any price to keep them fed and bedded (much hay is needed to keep barns functioning even if not eaten).

It is highly likely there will be a big spike in meat prices after the effects work through the system. Now add in that China is having a terrible time with swine flu and are trying to buy up replacement pork / pigs from all over the world (so pork prices will not be low any time soon) and chickens need “chicken feed” that is largely corn and soybeans (both late to plant so likely a low yield) and you can see where this is going.

Here’s where we were 3 months ago. It has not gotten better.

https://www.agriculture.com/news/crops/hay-shortage-grows-prices-nearly-double

(All CAPS theirs)

HAY SHORTAGE GROWS, PRICES NEARLY DOUBLE
HAY BUYERS NEED WINTER TO GET OVER SOON.
By Mike McGinnis
4/18/2018

DES MOINES, Iowa — As winter storms continue to pound the upper Midwest, cow/calf and feedlot operators are running out of hay to feed their animals.

With snow stunting the growth of spring pastures, the depth of the hay shortage that started in the drought-stricken fall of 2017 has been exacerbated.

Usually cattle farmers can kick animals out to pasture May 1, but that will not be the case this year.

So, the need for hay is extending further into spring than normal.

Paul McGill, owner of Rock Valley, Iowa, Hay Auction Co., sells hay to buyers in Iowa and Minnesota. “We need winter to get over soon,” McGill says.

Well the rains and flooding have continued across the Midwest. Some parts have dried enough they can likely start to pasture the animals, but a lot of the land is still flooded or so soggy a cow will get stuck. In others, it may be dry but a couple of months of growth has been lost. It isn’t over even when the water dries off.

HAY PRICES SURGE
Of course, this a supply/demand story right now for the hay market.

Large round bales of hay are selling for $75 to $90 per ton higher than a year ago, McGill says.

Specifically, alfalfa-grade hay bales are priced between $140 and $165 per ton, while grass, midquality hay bales are selling for $125 to $150 per ton.

This week’s blizzard cut McGill’s northwest Iowa auction company’s sales of hay that it does have to offer.

“On Monday, we moved only 14 semi-loads of large bales vs. 92 semi-loads a week ago. Since the first of the year, we have seen sales below average,” McGill says.

There is some hay around, it is just hard to get to it, he says.

What’s the government got to say?

https://www.ams.usda.gov/mnreports/sf_gr315.txt

Randomely taking the first report from South Dakota (that ought not to be flooded by the Mississippi…) It looks like they have started getting hay loads with 30, double 2 weeks ago and much more than last year. Alfalfa is now $165 / ton for new crop when it was $140 – $165 just a couple of months ago. The mid-grade “good” quality “grass” is at $145 when it had been $125-$150. That alfalfa in “fair” condition is available at $115 +/- so somebody will be eating crummy hay…

I’ve bolded a couple of places where they say some kinds of cheaper hay are now “scarce”. One of them says “scare” and I’ve got to wonder if that’s a typo or a slip of the emotional state… Also note these prices are FOB SD so trucking it to Iowa is going to cost… (Iowa gets a lot of hay from South Dakota)

SF_GR315
Sioux Falls, SD Tues June 11, 2019 USDA-SD Dept of Ag Market News

Corsica, SD Hay and Straw Auction for Monday, June 10, 2019

Receipts: 30 Loads Two Weeks Ago: 15 Loads Last Year: 13 Loads

All prices dollars per ton FOB Corsica, SD.

One load Small Squares equals approximately 5 tons; Large Squares and
Large Rounds range from 10-25 tons per load.

Alfalfa: Premium: Large Rounds, 1 load 162.50 (New Crop). Good:
Small Squares, 1 load $5.10/bale (New Crop); Large Rounds, 3 loads
122.50-127.50 (1 load 127.50 New Crop 10-15% Moisture). Fair: Large
Rounds, 8 loads 112.50-117.50. Utility: Large Rounds, 1 load 102.50.

Grass: Good: Large Rounds, 1 load 145.00. Fair: Large Rounds, 8
loads 110.00-127.50. Utility: Large Rounds, 3 loads 97.50-102.50.

Straw: Scare.

Millet Hay: Large Rounds, 1 load 87.50-90.00.

Corn Stalks: Scarce.

      Alfalfa guidelines (domestic livestock use and not more than 10 pct 
grass)
Quality       ADF      NDF       RFV       TDN-100 pct   TDN-90 pct   CP
Supreme       <27      185         >62          >55.9       >22
Premium      27-29    34-36    170-185    60.5-62        54.5-55.9  20-22
Good         29-32    36-40    150-170      58-60        52.5-54.5  18-20
Fair         32-35    40-44    130-150      56-58        50.5-52.5  16-18
Utility       >35      >44      <130         <56          <50.5       <16

RFV calculated using the WI/MN formula. TDN calculated using the
western formula. Quantitative factors are approximate and many factors
can affect feeding value. Values based on 100 pct dry matter.

Quantitative factors are approximate, and many factors can affect
feeding value. Values based on 100 pct dry matter. End usage may
influence hay price or value more than testing results.

   Grass Hay guidelines
Quality       Crude Protein Percent 
Premium            Over 13
Good                  9-13
Fair                   5-9
Utility            Under 5

Source: USDA-SD Dept of Ag Market News Service, Sioux Falls, SD
605-372-8350
http://www.ams.usda.gov/mnreports/SF_GR315.txt
http://www.ams.usda.gov/lpsmarketnewspage

0837c rmk

Then Ice Age Farmer has a couple of videos on corn, soybean, fruit and more. He can be a bit prone to “talking things up” but has a good collection of sources. And yes, I do think you ought to have some kind of food storage system (covered in depth in prior articles here: https://chiefio.wordpress.com/category/emergency-preparation-and-risks/ on “Dry Canning” and Food Storage in jars).

I do not think we’ll see much more than a meat price hike and some expensive farm feed. Since about 1/3 of corn goes into making gasoline that’s not as effective (hey, I’ve measured my mpg loss…) we can make up for a 1/3 loss of the corn crop by just putting the ‘ethanol mandate’ on hold for a while. Premium gas will likely take a price hike as a lot of ethanol is used to blend it for higher octane (with cheaper gasoline base). Still, if folks are stupid, and our law givers are, they will do nothing but talk and fools will moan about “Global Warming”… so better to take care of it yourself.

I do believe in growing some percentage of your own food, if at all possible. I’ll have an update on my first hydroponic bed later. In just 2 weeks I have one lettuce transplant about ready for the first harvest! Others about 2 weeks behind it.

Here’s a couple of his videos:

Flooding in the USA and grain:

Fruit in China (& more):

 Subscribe to feed

Why Socialism Is a Bad Alternative to Capitalism for Natural Resource Development and Environmental Protection

Alan Carlin | June 2, 2019
As discussed last week, the Climate Socialists in the US Democratic Party ultimate objective appears to be to replace capitalism by socialism. It is clear, however, that Socialism has a dismal record both in leading to environmental problems and in inadequate development and use of sensitive but highly productive new techniques. The environmental records of Soviet communism and Cuba are about as dismal as one can find. Socialism is simply not very good at safeguarding the environment.

So since the Climate Socialists claim extreme concern for the environment to the point of emphasizing a non-problem (climate change) as a reason to overthrow capitalism, they either do not understand the dismal experience or deliberately ignore it. The result is that the Climate Socialists are advocating that environmental problems be “solved” by switching to a system that will end up being worse for the environment and for economic progress. Whatever advantages socialism may offer, environmental protection is certainly not one of them nor is timely development and use of improved production techniques.

The Importance of Property Rights

Consider the case of property rights. They are important in capitalism and minor or missing under socialism. Under capitalism some property rights systems include rights to subsurface minerals. In general, the US has them and Europe does not. This seemingly minor difference has generally allowed fracking to flourish in the US and flounder in Europe.

The result is that the US is now the dominant world producer of oil and natural gaswhile much of Europe is playing a smaller and smaller role. Similarly for environmental impacts of resource decisions, the Soviet Union had a dismal environmental recordwhile the US has done very well. The reason is that many oil and gas resources are privately owned and the owners can object or sue polluters in many cases. Under Socialism these decisions are much more often made by governments with little opposition from private groups since no one has a personal ownership stake in the outcome.

The reason for this is that Capitalism provides some protections for property rights and usually allows people to use their property to make profits regardless of what current popular beliefs may hold. Under capitalism, property rights give someone a reason to object if their property rights are infringed. As a result, if someone is polluting the air over someone else’s property they are likely to object and try to do something about it.The history of the destruction of the Aral Sea is an example of such pollution in a Socialist country; the history of the development of fracking in recent years is an illustration of productive adoption of new technology in a Capitalist country. The development of fracking as the basis for a new US dominance in oil and natural gas production was made possible by private subsurface property rights in most of the US, particularly in the red states. The lack of such rights in many countries in Western Europe explains why fracking has been ignored in such countries and in some blue states that have effectively outlawed it.

What the Climate Socialists are proposing is government intervention in the market that will reduce incentives to adopt new technology that increases productivity and incentives to avoid environmental degradation. I cannot think of a better way to make the world worse off. Yet the climate socialists claim they are environmentalists. It is important for voters to understand this. We need both a good environment and a prosperous economy.

Manipulated Temperature Data Drives Global Warming Scare

Before we address the surprising announcement by NASA scientist Martin Mlynczak, late last year, that the Earth’s upper atmosphere is cooling, it is important to understand the data manipulation that has been going on for many years by both NASA and the National Oceanographic and Atmospheric Administration (NOAA).

As can be seen by the following graph, the Earth’s surface temperature appears to track reasonably well with the increases in carbon dioxide (CO2) levels in recent decades.


However, much of the underlying temperature data has been continuously manipulated by NASA and NOAA to bolster concerns about man-made climate change.

For years, climate activists in charge at NOAA and NASA were surprised that their own data and satellite measurements had been showing the climate to be stable or cooling since 1998 while CO2 levels had continued to rise. They were under intense pressure to explain how this could be happening in the face of the alarmist reports put out by the United Nations Intergovernmental Panel on Climate Change.

It was clearly time to resort to the strategy that progressives use in times of crisis: if you do not like the facts, ignore them and create your own, in accord with George Orwell’s famous novel 1984. Such an approach has been followed by tyrannical leaders down through the ages.

The publication Frontiers of Freedom in their February 23, 2016 issue documented what has been done in an article by Thomas Richard titled “How NOAA Rewrote Climate Data to Hide Global Warming Pause.”

The falsification of climate data by NOAA and NASA covers more than just the past decade. The U.S. has published temperature data beginning in 1880 up to the present. Climate realist blogger Tony Heller shows how their data has been tinkered with many times in past years, in “The History of NASA/NOAA Temperature Corruption.”

Below we show a graph (extracted with permission of the publisher from The Mythology of Global Warming, by Dr. Bruce Bunker (2018)) of the NASA average temperature data across the U.S. starting in 1880 posted in 1999. Directly below on the same chart is the data NASA posted for the very same years in 2016 after government manipulation of what was presumably generated from the same underlying data set.


This obvious alteration of reality should be an embarrassment to NASA. It has not gone unnoticed.

Perhaps not surprisingly, the climate curve recalculated in 2016 is now in agreement with the global warming movement. The cooling trend between 1940 and 1970 that led climate alarmists to warn that fossil fuel emissions were plunging the Earth into another Ice Age has been largely eliminated. The data now show that temperatures are increasing exponentially along with rising CO2. The new curve shows the Earth’s temperature increased 1.4 degrees Celsius since 1880. Temperatures that are out of line with the prediction of alarmists are gradually and systematically adjusted and replaced by ‘corrected’ computer-generated temperatures. Children who are fed this new data are being recruited to beg us to save their futures.

Dr. Bunker explained what has happened in the case of NOAA data:

“Rep. Lamar Smith (R-Texas), who runs [prior to the 2018 election] the House of Representatives Science and Technology committee, has demanded that NOAA produce their data for independent analysis. NOAA has refused to release the subpoenaed documents. Judicial Watch has sued NOAA under the Freedom of Information Act to obtain access to their data. NOAA continues to refuse to turn over the documents.”

The new truth seeping out from NASA was first reported in the New American magazine by James Murphy in October 2018 where he quoted Martin Mlynczak of NASA’s Langley Research Center, saying:

“High above Earth’s surface, near the edge of space, our atmosphere is losing heat energy. If current trends continue, it could soon set a Space Age record for cold.” 

Major media outlets completely ignored this information.

This new revelation comes from NASA’s SABER instrument aboard NASA’s TIMED satellite. SABER stands for Sounding of the Atmosphere using Broadband Emission Radiometry and TIMED stands for the Thermosphere Ionosphere Mesosphere Energetics and Dynamics.

SABER monitors infrared radiation (i.e., heat) from CO2 and nitrous oxide (NO) molecules which are two of the gases that play a major role in releasing energy from the thermosphere (which starts at 50 miles altitude) at the top of our atmosphere. Mlynczak, who is the associate principal investigator for SABER, added,

“the thermosphere always cools off during Solar Minimums. It’s one of the most important ways the solar cycle effects our planet”.

Solar Minimums are time frames when the Sun is less active and so releases less radiation toward the Earth.

Mlynczak invented the Thermosphere Climate Index (TCI) as a measure of the rate of energy release (in Watts) that NO molecules emit into space from the thermosphere. The following graph shows TCI dropping as we move into the current Solar Minimum. TCI values are approaching the lowest ever since measurements began.


Murphy reminds us about the forecasts of a Grand Solar Minimum in the coming decades, similar to the Maunder Minimum of the mid-17th to early 18th centuries, which coincided with the Little Ice Age, when temperatures were much lower than those of today. He concludes,

“All any of this proves is that we have at best a cursory understanding of Earth’s incredibly complex climate system. So when mainstream media and carbon credit salesman Al Gore breathlessly warn you that we must do something about climate change, it’s alright to step back, take a deep breath, and realize that we don’t have the knowledge, skill or resources to have much effect on the Earth’s climate.”

Yet, Democrats and misguided Republican politicians want us to invest trillions of dollars to completely revamp the way in which we generate energy to supposedly save the climate. Talk about insanity.


(graphs source: http://climate4you.com/)

How NOAA rewrote climate data to hide global warming pause

by Thomas Richard     •     Examiner

The number of excuses for the global warming pause or hiatus had grown to more than 66 when the National Oceanographic and Atmospheric Administration (NOAA) added yet another one to the list in a just-published study in Science. In their argument that came out yesterday, NOAA said that long-existing instrument bases have masked rising sea surface temperatures. Once they “readjusted” the data, the warming hiatus disappeared. By cooling the past, they were able to make the most recent years even warmer.

This assessment has drawn heavy criticism from both sides of the bitter climate debate, but one thing no one disputes: NOAA may have overstepped its authority in rewriting climate history and relying on faulty data sets. By making the early 1900s colder, and using only land-based temperature stations and less-reliable ocean temperatures, NOAA can now readjust the past to chart a new future.

This new study also comes at a time when President Obama has shifted his focus to climate change, not to mention the EPA’s proposed plans to completely revamp the country’s power plant system through new regulations.

One thing is clear: NOAA didn’t rely on satellite temperatures, which clearly shows a global warming pause for the past 19 years. or the much more reliable ARGO buoys for ocean temperatures. According to The Daily Caller, “new satellite-derived temperature measurements show there’s been no global warming for 18 years and six months.” Satellite data is preferable because it measures the first two miles of the lower atmosphere, and is accurate to within .001 degrees Celsius.

Even the Intergovernmental Panel on Climate Change (IPCC) acknowledged two years ago that the rise in Earth’s mean surface temperatures had begun to slow since 1998, and since then everything from volcanic activity to solar output to the oceans absorbing the extra heat have been put forward to explain the pause. Others believe the missing heat is hiding in the Deep Oceans, far from any sort of sensors or temperature gauges. NOAA is one of four independent organizations that gather and analyze global temperatures, and the three other groups have all detected a slowdown in the rate of global warming, which is why the IPCC mentioned the “hiatus” in the first place.

The study, led by Thomas Karl, of NOAA’s Climatic Data Center, said once the data was ‘adjusted’ and the biases accounted for, “this hiatus or slowdown simply vanishes.” Karl et al insists that global average surface temperature has climbed 0.2 degrees Fahrenheit each decade since 1950, without interruption, due to the heat-trapping effects of carbon dioxide emissions.

Not everyone agrees. Judith Curry, a climate scientist at Georgia Tech who doesn’t find this analysis at all convincing, writes, “While I’m sure this latest analysis from NOAA will be regarded as politically useful for the Obama administration, I don’t regard it as a particularly useful contribution to our scientific understanding of what is going on.” She went on to say that it “seems rather ironic, since this is the period where there is the greatest coverage of data with the highest quality of measurements — ARGO buoys and satellites don’t show a warming trend.”

Three climatologists at the CATO Institute released a joint statement about the NOAA adjustment report: “While this will be heralded as an important finding, the main claim that it uncovers a significant recent warming trend is certainly dubious. The significance level (.10) is hardly normative and the use of it certainly will prompt many readers to question the reasoning behind the use of such a lax standard.”

“I would argue the study is misleading on the implications of its results,” said Piers Forster, an atmospheric physicist at the University of Leeds, in England. “This study has not ‘magicked’ the hiatus away or somehow corrected the IPCC.” Indeed, scientists who have investigated the warming hiatus said the study’s “key shortcoming is that it does what mainstream climate scientists accuse climate skeptics of doing: cherry-picking start and end dates to arrive at a particular conclusion.”

Gerald Meehl, a climate researcher at the National Center for Atmospheric Research (NCAR) in Boulder, Colorado, told Mashable in an email that “My conclusion is that even with the new data adjustments, there still was a nominal hiatus period that lasted until 2013 with a lower rate of global warming than the warming rate of the last 50 years of the 20th century, and a factor of two slower warming than the previous 20 years from the 1970s to 1990s.”

Lisa Goddard, director of the International Research Institute for Climate and Society (IRI) at Columbia University, also told Mashable that “the study does not support the conclusion that global warming didn’t slow down for a relatively short time period. ‘It is clear that Karl et al. have put a lot of careful work into updating these global products,’ Goddard said in an email. ‘However, they go too far when they conclude that there was no decadal-scale slowdown in the rate of warming globally. This argument seems to rely on choosing the right period — such as including the recent record-breaking 2014.’”

Another climate researcher, Peter Thorne, a climate researcher at Naynooth University in Ireland, said in an interview that “more investments should go toward establishing redundant, carefully calibrated temperature-observing networks where data is currently sparse, such as the Arctic, much of Africa and especially the oceans.”

Even more surprising is that climate scientists who believe that man is solely responsible for the planet warming less than a degree Celsius in the past 100 years also rejected NOAA’s assessment that the slowdown is not occurring. “It is a bit misleading to say there is no hiatus,” said climate scientist Kevin Trenberth of the National Center for Atmospheric Research.

“This new study suggests that the slowdown in the rate of warming may be much less pronounced than in the global temperature records that were available for the IPCC to assess,” said Professor Tim Osborn of the University of East Anglia, which handles the UK data set with the Met Office Hadley Centre. “The IPCC’s assessment wasn’t wrong, but perhaps the emphasis would be slightly different if the assessments were carried out afresh with the new studies since 2013 that could now be considered.”

“I would caution against dismissing the slowdown in surface warming on the basis of this study … There are other data sets that still support a slowdown over some recent period of time, and there are intriguing geographical patterns such as cooling in large parts of the Pacific Ocean that were used to support explanations for the warming slowdown,” Osborn added.

As Judith Curry writes, “In my opinion, the gold standard data set for global ocean surface temperatures is the UK data set, HadSST3. A review of the uncertainties is given in this paper by John Kennedy. Note, the UK group has dealt with the same issues raised by the NOAA team. I personally see no reason to the use the NOAA ERSST data set, I do not see any evidence that the NOAA group has done anywhere near as careful a job as the UK group in processing the ocean temperatures.”

As Marc Morano of the site Climate Depot noted in an interview with National Geographic, “NOAA’s new study will have “virtually no impact in the climate debate. … This latest study merely adds to the dueling data sets and of course time lines in the climate debate.”