America’s power grid at the limit: the road to electrical blackouts

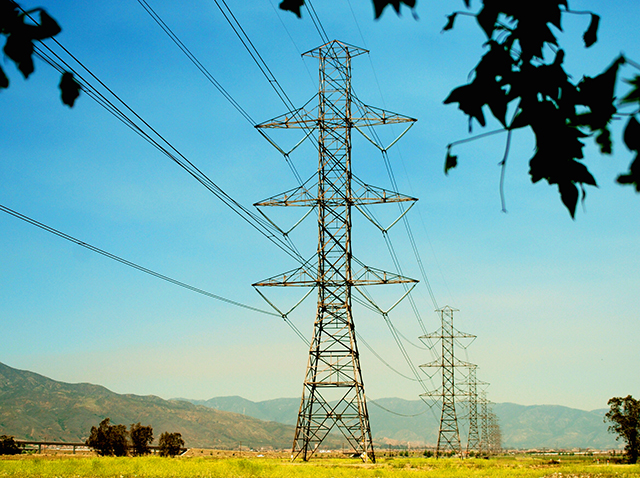
CHICAGO, April 23, 2014 — Americans take electricity for granted. Electricity powers our lights, our computers, our offices, and our industries. But misguided environmental policies are eroding the reliability of our power system.

Powerlines-CA-Article

This past winter, bitterly cold weather placed massive stress on the US electrical system―and the system almost broke. On January 7 in the midst of the polar vortex, PJM Interconnection, the Regional Transmission Organization serving the heart of America from New Jersey to Illinois, experienced a new all-time peak winter load of almost 142,000 megawatts.

Eight of the top ten of PJM’s all-time winter peaks occurred in January 2014. Heroic efforts by grid operators saved large parts of the nation’s heartland from blackouts during record-cold temperature days. Nicholas Akins, CEO of American Electric Power, stated in Congressional testimony, “This country did not just dodge a bullet―we dodged a cannon ball.”

Environmental policies established by Congress and the Environmental Protection Agency (EPA) are moving us toward electrical grid failure. The capacity reserve margin for hot or cold weather events is shrinking in many regions. According to Philip Moeller, Commissioner of the Federal Energy Regulatory Commission, “…the experience of this past winter indicates that the power grid is now already at the limit.”

EPA policies, such as the Mercury and Air Toxics rule and the Section 316 Cooling Water Rule, are forcing the closure of many coal-fired plants, which provided 39 percent of US electricity last year. American Electric Power, a provider of about ten percent of the electricity to eastern states, will close almost one-quarter of the firm’s coal-fired generating plants in the next fourteen months. Eighty-nine percent of the power scheduled for closure was needed to meet electricity demand in January. Not all of this capacity has replacement plans.

In addition to shrinking reserve margin, electricity prices are becoming less stable. Natural gas-fired plants are replacing many of the closing coal-fired facilities. Gas powered 27 percent of US electricity in 2013, up from 18 percent a decade earlier. When natural gas is plentiful, its price is competitive with that of coal fuel.

But natural gas is not stored on plant sites like coal. When electrical and heating demand spiked in January, gas was in short supply. Gas prices soared by a factor of twenty, from $5 per million BTU to over $100 per million BTU. Consumers were subsequently shocked by utility bills several times higher than in previous winters.

On top of existing regulations, the EPA is pushing for carbon dioxide emissions standards for power plants, as part of the “fight” against human-caused climate change. If enacted, these new regulations will force coal-fired plants to either close or add expensive carbon capture and storage technology. This EPA crusade against global warming continues even though last winter was the coldest US winter since 1911-1912.

Nuclear generating facilities are also under attack. Many of the 100 nuclear power plants that provided 20 percent of US electricity for decades can no longer be operated profitably. Exelon’s six nuclear power plants in Illinois have operated at a loss for the last six years and are now candidates for closure.

What industry pays customers to take its product? The answer is the U.S. wind industry. Wind-generated electricity is typically bid in electrical wholesale markets at negative prices. But how can wind systems operate at negative prices?

The answer is that the vast majority of U.S. wind systems receive a federal production tax credit (PTC) of up to 2.2 cents per kilowatt-hour for produced electricity. Some states add an addition credit, such as Iowa, which provides a corporate tax credit of 1.5 cents per kw-hr. So wind operators can supply electricity at a pre-tax price of a negative 3 or 4 cents per kw-hr and still make an after-tax profit from subsidies, courtesy of the taxpayer.

As wind-generated electricity has grown, the frequency of negative electricity pricing has grown. When demand is low, such as in the morning, wholesale electricity prices sometimes move negative. In the past, negative market prices have provided a signal to generating systems to reduce output.

But wind systems ignore the signal and continue to generate electricity to earn the PTC, distorting wholesale electricity markets. Negative pricing by wind operators and low natural gas prices have pushed nuclear plants into operating losses. Yet, Congress is currently considering whether to again extend the destructive PTC subsidy.

Capacity shortages are beginning to appear. A reserve margin deficit of two gigawatts is projected for the summer of 2016 for the Midcontinent Independent System Operator (MISO), serving the Northern Plains states. Reserve shortages are also projected for the Electric Reliability Council of Texas (ERCOT) by as early as this summer.

The United States has the finest electricity system in the world, with prices one-half those of Europe. But this system is under attack from foolish energy policies. Coal-fired power plants are closing, unable to meet EPA environmental guidelines. Nuclear plants are aging and beset by mounting losses, driven by negative pricing from subsidized wind systems. Without a return to sensible energy policies, everyone must prepare for higher prices and electrical grid failures.

Steve Goreham is Executive Director of the Climate Science Coalition of America and author of the book The Mad, Mad, Mad World of Climatism: Mankind and Climate Change Mania.

Read more at http://www.commdiginews.com/business-2/legal-insurance-marketing/americas-power-grid-at-the-limit-the-road-to-electrical-blackouts-15826/#Rk3EBgH3Vtaxsqbr.99

Examiner Editorial: American energy independence in sight despite Obama

BY WASHINGTON EXAMINER | APRIL 16, 2014 AT 6:51 AM

Booming oil and natural gas production made possible by technological advances in hydraulic fracturing and horizontal drilling has been the lone bright spot in the U.S. economy throughout President Obama’s tenure in the Oval Office. The U.S. Energy Information Administration released data last week that effectively illustrates the boom, saying “total U.S. net imports of energy, measured in terms of energy content, declined in 2013 to their lowest level in more than two decades. Growth in the production of oil and natural gas displaced imports and supported increased petroleum product exports, driving most of the decline. A large drop in energy imports together with a smaller increase in energy exports led to a 19% decrease in net energy imports from 2012 to 2013.”

The EIA also made public its latest long-term projections, including the U.S. achieving energy independence by 2037 — that is, zero net oil imports from the Middle East and other foreign producers — under the most optimistic of those scenarios. Driving the increasingly optimistic projections from the EIA is growing productivity in the Eagle Ford Shale area of Texas and North Dakota’s Bakken Shale area. The new-rig count in Texas, for example, has zoomed from less than 100 in mid-2009 to more than 300 today, while oil production has gone from a mere 30 barrels per day in 2009 to more than 500 today, according to EIA data. No wonder an EIA spokesman told Bloomberg News “this is the first time the Annual Energy Outlook has projected that net imports’ share of liquid fuels consumption could reach zero.”


Since Obama took office, total federal oil production has declined 7.8 percent and federal natural gas production has declined 21 percent.

It’s not all good news on the energy front, however, thanks to Obama. The Department of the Interior’s Bureau of Land Management released new data showing the federal government’s issuance of new onshore oil and natural gas leases and permits crawling along at levels that in some respects are the lowest since President Reagan was in office:

• BLM leased 1.2 million acres in 2013, down from 1.8 million acres leased the year before and the smallest area since at least 1988, the earliest year BLM reported data.

• BLM issued 1,468 oil and natural gas leases in 2013, down from 1,729 issued the year before.

• BLM issued 3,770 drilling permits in 2013, down from 4,256 permits issued the year before and the lowest level since 2002.

“This data confirms that the Obama administration is purposely stifling American energy production wherever it can. Since Obama took office, total federal oil production has declined 7.8 percent and federal natural gas production has declined 21 percent. This is unacceptable and forfeits the opportunity to create good-paying jobs and grow our economy,” said House Natural Resources Committee Chairman Doc Hastings.

A Washington state Republican, Hastings is retiring at the end of the current Congress, so he is perhaps in a position to be more candid on these issues than other congressmen who are seeking re-election. The BLM data makes clear, though, that the American energy boom is happening despite, not because, of the man in the White House.

Death by solar farms: 71 species of birds killed, ‘entire food chains’ disrupted

By Douglas Ernst -The Washington Times

A new report by the U.S. Fish and Wildlife Service finds that solar facilities in California are acting like “mega traps” that kill and injure birds. As a result, “entire food chains” are being disrupted.

USFWS’s National Fish and Wildlife Forensics Laboratory studied three solar farms in Southern California: Desert Sunlight, Genesis Solar and Ivanpah Solar Electric Generating System (ISEGS). Two-hundred and thirty-three different birds from 71 species were found over the course of a two-year study.

The three main causes of death were:

1. Solar flux: Exposure to temperatures over 800 degrees F.

2. Impact (or blunt force) trauma: The birds’ wings are rendered inoperable while flying, causing them to crash into the ground. Birds that do not die are often injured badly enough to make them vulnerable to predators.

3. Predators: When a bird’s wings are singed and it can not fly, it loses its primary means of defense against animals like foxes and coyotes.

Hummingbirds, swifts, swallows, doves, hawks, finches, warblers and owls were just some dead birds found at the solar facilities’ “equal opportunity” mortality hazards.
In one instance, lab staff observed a “falcon-type bird with a plume of smoke arising from the tail as it passed through [a] flux field.”

The study found that besides the intense heat, birds may be mistaking large solar panels for bodies of water. The injured birds then attract insects and other predators to the area. They, too, are then vulnerable to injury or death.

In one instance, researchers found “hundreds upon hundreds” of butterfly carcasses (including Monarchs). The insects were attracted to the light from the solar farms, which in turn attracted birds and perpetuated a cycle of death and injury.

One of the recommendations of the study, which stated that the number of deaths was likely underrepresented, was to retrofit solar panels to discourage birds and insects from congregating in the area.
California’s KCET, a public television station, reported the findings of the USFWS’s report may affect the state’s decision to proceed with the Palen Solar Electric Generating System, “a much larger version of Ivanpah proposed for the Chuckwalla Valley in Riverside County.”

Read more: http://www.washingtontimes.com/news/2014/apr/11/death-calif-solar-farms-71-species-bird-found-enti/#ixzz2yy0YGGG7
Follow us: @washtimes on Twitter

Global Cooling – The REAL Inconvenient Truth: Part 1

Three months ago, it snowed in Cairo, Egypt for the first time in 112 years.

GlobalCooling-snow-in-Cairo

2013 was the largest one-year temperature drop ever recorded in the United States.

The extent of the Antarctic sea ice is at record highs.

It’s the Real Inconvenient Truth—right now the world is getting colder. And it’s likely to get even colder for the next 20 years—before a new, stronger cycle of sunspots begins, as they have for eons. They are statistically very, VERY accurate.

But there’s more, and it’s A Sad Truth: there is ample evidence that suggests private scientists and public servants have been manipulating the basic raw data that most everyone relies on to calculate climate change. (This story has great timing as the IPCC–International Panel on Climate Change–just released Part 5 of their most recent major assessment on climate science (even they can’t bring themselves to call it Global Warming anymore).)

There are some investment trends that come out of this new Truth, and some of it is as simple as get long snowmobile makers and get short lawn mowers. One trend is that Global Cooling should bring more seasonality in oil and gas prices, making energy ETF and commodity traders happy.

All of this is part of a new ground-breaking study completed by Unit Economics, an investment think-tank from Boston. They are a non-partisan group with no axe to grind on this issue; like me, they are here to make money for their clients. Show us a trend and we’ll figure out how to profit from it.

In Part I, you’ll understand the big swings in temperature the earth has experienced in the last million years, and the last thousand years, and the last 50 years. In Part II I’ll explain how sunspot activity directly correlates to ALL these temperature changes. And I’ll give you a hot, near-term investment trend to capitalize on this cool idea.

And in Part III, I’ll show you how some original research by Unit Economics has uncovered some disturbing data about the integrity of Global Warming science. And really, all they’re doing is adding to an already big pile.

BACKGROUND AND CONTEXT

Satellites first started measuring earth’s temperature in 1979. Over the next 20 years, temperatures did rise, by roughly 0.5 degrees Celsius (0.9°F). In the 15 years since, that trend has reversed–rendering the total temperature increase since 1979 a mere 0.35°C (0.6°F), well within the range of statistical noise.

The real culprit for climate change is simply—the sun, through a complicated but predictable set of cycles.

Those cycles predicted today’s cooling trend – and they predict it will continue for another two decades and may well lead to the coldest period on earth in the last 1,200 years.

The Earth, the Sun, and the Temperature

The earth’s cycle around the sun stretches and contracts, creating 100,000-year temperature cycles. Our planet also slowly tilts one way and then the other, resulting in 41,000-year temperature cycles.

We know this because scientists have several methods to estimate historic weather, an effort that has produced this general result:

View gallery
.
A few things jump out.

1. The 100,000-year temperature cycles are very apparent – and the current one is peaking.
2. The timeframe of this chart covers ice ages and tropical periods, which means it takes only a small change in global temperatures – only two to four degrees – to separate a very warm world from a very cold one.
3. Through the cycles of the last 800,000 years, the average global temperature is creeping upwards.
4. The magnitude of each cycle seems to be increasing.

Now, this chart should be taken with a grain of salt because the methods we use to conjure these numbers are not perfect. But at least the chart lets us put recent climate changes into historic context – a context that deserves a closer look.

The key takeaway is that the earth has been through some very warm periods and some pretty cold ones. Take the years between 800 and 1200 AD, for example. During these 400 years it was so warm that vineyards spread across central England and bountiful harvests almost doubled Europe’s population.

Then it all changed. By the mid-1300s England’s vineyards were gone and sea ice expanded so much that polar bears crossed to Greenland. This short cold snap was truncated in about 1400, when warmer weather returned for 150 years. Get the idea? Up, then down, then up, then down. And then came the Little Ice Age.

Lasting from 1550 right until 1850, the Little Ice Age froze Austria’s vineyards, forcing parched Austrians to switch from wine to beer. Winter fairs were held on the frozen Thames River for 20 years (you’ve all seen the paintings) and Hudson Bay was littered with ice chunks in mid-summer.

This period of time was so cold it earned the moniker The Dalton Minimum—a reference to the very low number of sunspots then. In the year 1816, storms dumped snow across New England and Quebec in June, lake ice lasted until August in Pennsylvania, and failed crops led to food riots in Britain and France.

So when you get asked, is the world warmer over the last 200 years, since the Industrial Revolution started? Yes, but it has squat to do with industry. That just happens to co-incide with the smallest sunspot activity in “modern” times.

Eventually the world started to warm again. From 1890 to 1934 central Europe barely saw any snow. Another warm spell from 1942 to 1953 had scientists predicting the death of Europe’s glaciers, a forecast invalidated when the world once again cooled.

Here’s some interesting data as we get closer to the present day:

1. Temps continued to fall from 1953 until the mid-1970s – despite rising CO2 levels. This was during the single most industrializing time on earth—and temperatures fell while CO2 levels rose.

2. Another point: if CO2 emissions cause global warming the layer of the atmosphere 5 to 10 km (3-6 miles) above the earth where CO2 interacts with sunlight should be warming more quickly than the earth’s surface. In fact, temperatures at these levels have been unchanged since accurate balloon measurements became available 50 years ago.

3. There has been a large outcry about the decline of Arctic Ice. While Arctic sea ice extent is just above average levels, Arctic sea ice is near record thickness: the volume of ice in the Arctic last fall was 50% higher than 12 months prior, following a very cold summer in 2013 in which temps climbed above freezing only 45 days compared to an average of 90 days.

I bet you didn’t read about that.

4. There’s a lot of ice at the other end of the globe too. In eight of the last ten years global sea ice extent has bested the 30-year average, aided by an Antarctic sheet that in October hit its highest extent since record keeping started in 1979.

5. The Northern Hemisphere had its second, third, and fourth highest snow extents on modern record in 2010, 2011, and 2013. In the United States 2013 brought the largest year-over-year drop in temperature on record and the winter is on track to be labeled the third coldest in 200 years.

Evidence of this cooling is everywhere – even if politicians and the media try to pretend it isn’t. Of course, the media has short memories. Only 40 years ago, in mid-1974 Time magazine ran a cover story entitled “Another Ice Age?” noting a 12% increase in New Hampshire snow cover in 30 years.

Conclusion: over the last 1,200 years the earth has been through several pretty extreme temperature swings. What gives?

The answer lies with the sun. Cold periods coincide with solar minimums, which generally happen every 150 to 200 years. Warm periods coincide with solar maxima, which happen every 700 years or so.

In Part II, you will read about how accurately sunspot activity relates to earth’s temperatures, why the signs are indicating a deep cooling trend for the next 20 years (brrrrrr……), and one near term investment idea in the energy patch that should prosper greatly from this new trend.

Climate Activists Uncaged

3 April 2014
By Jonah Goldberg

Finally, someone has come up with a way to settle the debate over climate change: Put the people on the wrong side of the argument in cages.

A writer for the website Gawker recently penned a self-described “rant” on the pressing need to arrest, charge and imprison people who “deny” global warming. In fairness, Adam Weinstein doesn’t want mass arrests. (Besides, in a country where only 44 percent of Americans say there is “solid evidence” of global warming and it’s mostly due to human activity, you can’t round up every dissenter.) Fact-checking scientists are spared. So is “the man on the street who thinks Rush Limbaugh is right. … You all know that man. That man is an idiot. He is too stupid to do anything other than choke the earth’s atmosphere a little more with his Mr. Pibb burps and his F-150’s gassy exhaust.”

But Weinstein’s magnanimity ends there. Someone must pay. Weinstein suggests the government simply try the troublemakers and spokespeople. You know, the usual suspects. People like Limbaugh himself as well as ringleaders of political organizations and businesses that refuse to toe the line. “Those malcontents must be punished and stopped.”

Weinstein says that this “is an argument that’s just being discussed seriously in some circles.” He credits Rochester Institute of Technology philosophy professor Lawrence Torcello for getting the ball rolling. Last month, Torcello argued that America should follow Italy’s lead. In 2009, six seismologists were convicted of poorly communicating the risks of a major earthquake. When one struck, the scientists were sentenced to six years in jail for downplaying the risks. Torcello and Weinstein want a similar approach for climate change.

This is a great standard for free speech in America. Let’s just agree that the First Amendment reads, “Nothing in this clause shall be considered binding if it contradicts legal practices in the Abruzzo region of Italy.”

The truth is this isn’t as new an outlook as Weinstein suggests. For instance, in 2009, New York Times columnist Paul Krugman insisted that “deniers” in Congress who opposed the Waxman-Markey climate change bill were committing “treason” while explaining their opposition on the House floor. (That same year, Krugman’s fellow Timesman Thomas Friedman wrote that China’s authoritarian system was preferable to ours, in part, because it lets “enlightened” leaders deal with climate change.)

“The fact is that the planet is changing faster than even pessimists expected,” Krugman insisted. How fast the earth is changing is open to all kinds of debate, but short of an asteroid strike it won’t change as fast as the global warming pessimists have claimed. For example, in 2008, Al Gore predicted that the North Pole ice cap would be ice-free by 2013. Arctic ice, which never came close to disappearing, has actually been making a bit of comeback lately.

Gore’s prediction — echoed by then-Sen. John Kerry and countless others — was always ridiculous hyperbole. But even most serious, non-hyperbolic, computer-modeled predictions have overestimated the amount of warming we’ve experienced. The United Nations Intergovernmental Panel on Climate Change has had to retract several histrionic predictions, such as its erroneous prophecy that the Himalayan glaciers would be gone by 2035.

Its new report, out on Monday, contains a new raft of dire prophecies requiring trillions in new spending. If I greet it with skepticism, shall I pack a toothbrush for my trip to jail?

Climate-change activists insist that in science, revisions are routine, and that such corrections prove the good faith of scientists. Even if that’s true, one might still note that incentives are unhealthily arranged so that even well-intentioned researchers are encouraged to exaggerate the dangers of climate change and discouraged to criticize hyperbole. Moreover, were it not for the skeptics and deniers, many such corrections would never have been brought to light. (My own view is that man plays some role in warming, but the threat is overblown and the popular remedies range from trivial to unaffordable to ridiculous.)

The real problem is that political activists and many leading institutions, particularly in the news media and academia, are determined to demonize any kind of skepticism — about the extent of the threat or the efficacy of proposed solutions — as illegitimate idiocy.
That attitude is unscientific and undemocratic enough. But it sure beats calling for your opponents to be thrown in the gulag for disagreeing with you.

http://townhall.com/columnists/jonahgoldberg/2014/04/03/climate-activists-uncaged-n1817948/page/full